Data Wars: Python vs R
You want to dive into the field of Data Analytics but don’t know which language you should choose. R or Python? Well, it is not like choosing apples or oranges. However, each language has its own advantages. In this article, I try to help you in your decision-making.
Both R and Python are quite old. R was created in 1995 as an open source version of the language S by Ross Ihaka and Robert Gentleman. The main accent was made on analytics, statistics and visualization. It was designed by scientists and for scientists. However, nowadays, R is becoming more and more integrated into the business world.
Python was created by Guido van Rossum in 1991. The main accent making this language was made on easiness and readability. Today, you can use Python almost in any task, including data analysis. Numbers of data analysts use solely Python because it is where they started.
R is a hard language to learn, especially, if it is your first contact with a programming language. The learning curve of R is very steep. Nevertheless, if you are already familiar with programming, used some other language in the past, R will be easier for you to master. Today, you can find tons of online resources and books which will teach you R. Your questions will never be left unanswered, thanks to Stackoverflow and CRAN community.
In contrast, Python is very easy to learn, even if you haven’t faced programming before. Because its main purpose was easiness and readability. As in R, you will have Stackoverflow community at your disposal, should you have any questions or problems. Sources like Udemy, Datacamp will help you to learn Python in no time.
When to use R
Depending on your tasks and goals, R might be your way to go. Especially, if you want to do scientific research or some analysis on the go. It has many built-in functions and packages for data analysis and visualization. You can start right away. Most prominent packages are:
- dplyr, plyr and data.table for managing data tables and data frames,
- stringr for manipulating strings,
- zoo for time series analysis,
- ggvis, lattice , ggplot2 for data visualization,
- caret for machine learning
When to use Python
Python will be best to use when you need to implement your analysis into apps, web apps and data pipelines. However, in order to work with data, you need external libraries. Python doesn’t come with built-in packages like R does. Most prominent packages are:
- pandas for data manipulation
- scipy, numpy for numeric computing
- scikit-learn for machine learning
- Tensorflow, theano, keras for deep learning tasks
Advantages and drawbacks of using R
Pictures worth more than million words or numbers. If you visualize your data, they became more meaningful and easy to understand. R was built for visualization. Ggplot2, ggvis, rCharts and lattice should help you along the way.
R ecosystem. R has a huge ecosystem with modern packages and has an active community. You can find packages almost all the time on CRAN and if not, on BioConductor or GitHub.
R is lingua franca in analytics. R was made by statisticians for statisticians. You don’t need to dive in informatics part of the things, so, you can easily exchange your thoughts through R codes. R is becoming more and more popular in a non-academic sphere.
R is slow. R was made to ease your work, not your computer’s. Some operations may take longer than expected if your code is inconsistent. Remember that, R is a functional language, which means, you can rely on built-in or custom functions to speed up your work.
R is hard to learn. Yes, it is. Its syntax might not be easy to understand. Sometimes, you may need to read the snippet twice, in order to understand what it does.
Advantages and drawbacks of using Python
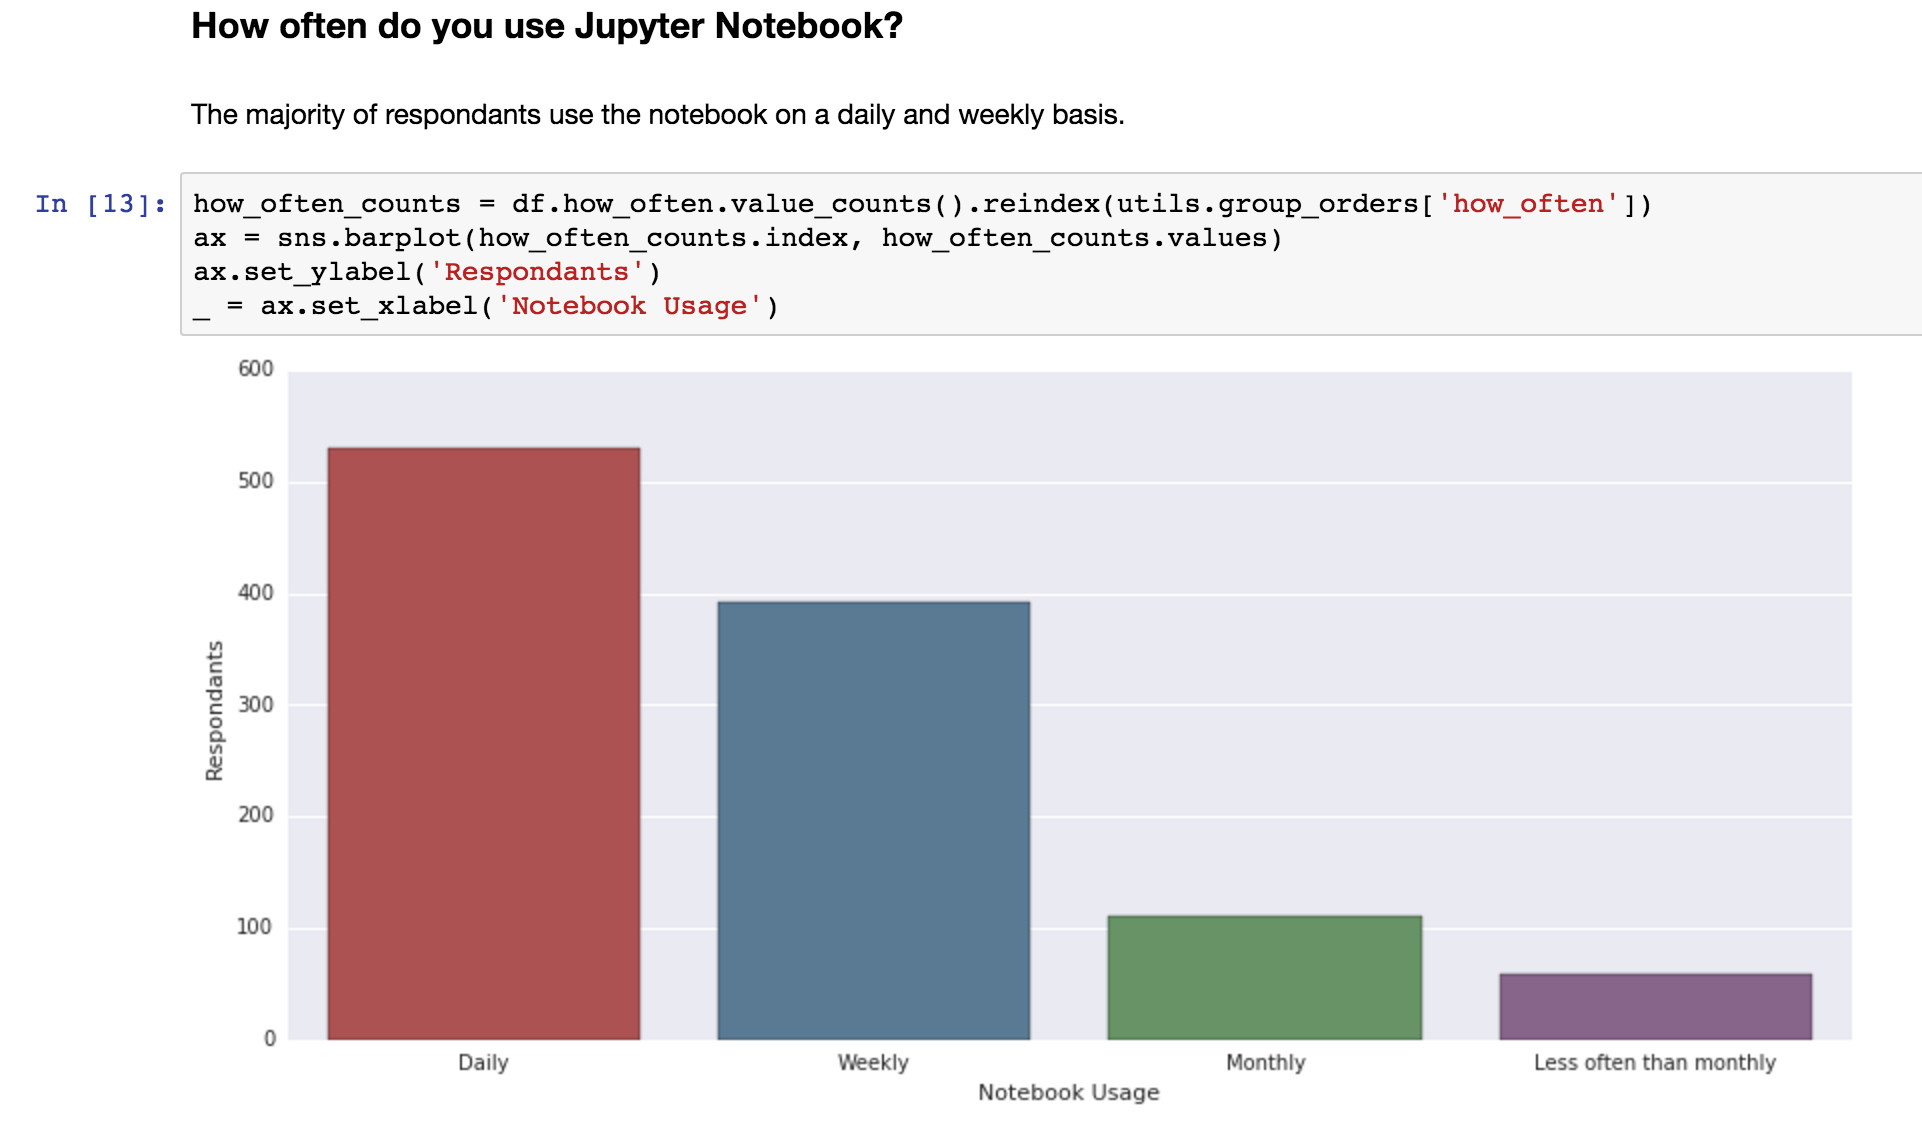
Jupyter Notebook. Easy to use, easy to manage. Life is easier with Ipython. You can use it with your colleagues without installing anything else. You can also try Spyder, Ipython Notebook, Rodeo. More time to do your work and less to care about the rest.
Python is a universal language. It was built as all-purpose language and it is easy to read and understand. The learning curve is plain enough. You can write small codes that do big things. Also, it is easy to integrate your solutions into products, as Python is well-known among people with different backgrounds.
Visualization can be tough. Visualization is essential in analytics. Python has some good packages like seaborn, bokeh, matplotlib, but this choice is perhaps wider than needed. Detailed plotting is time-consuming in Python.
I started with Python having no background in programming at all. It seemed easier to me. Also, I liked the Jupyter Notebook very much. Not only is it user-friendly, but also it has built-in “cells” where you can write your code step-by-step which will be easier for you and readers to follow along. Inline graphs are also awesome. With magic functions which are exclusive for this tool, you can do many useful things. The only “drawback”, if so, is that it is a web-based tool. You need a browser to use it.

Yet, after using R a bit, I started preferring R over Python when doing solely analytics. The main reason was that R had lots of useful built-in packages. I didn’t need to install any additional package in order to calculate the mean, standard deviation plotting or manipulating the data.
Which one should you choose? It is heavily depending on your project. If your project involves deep learning, requires complex data pipelines, or should be integrated into a product, go for Python. If you excel functional programming, need to play with your data, find or show insights, R is your best friend. Always remember that, if you torture the data long enough, it will confess (Ronald Coase).